Population vs Sample (02)


What are Population & Sample in Statistics?
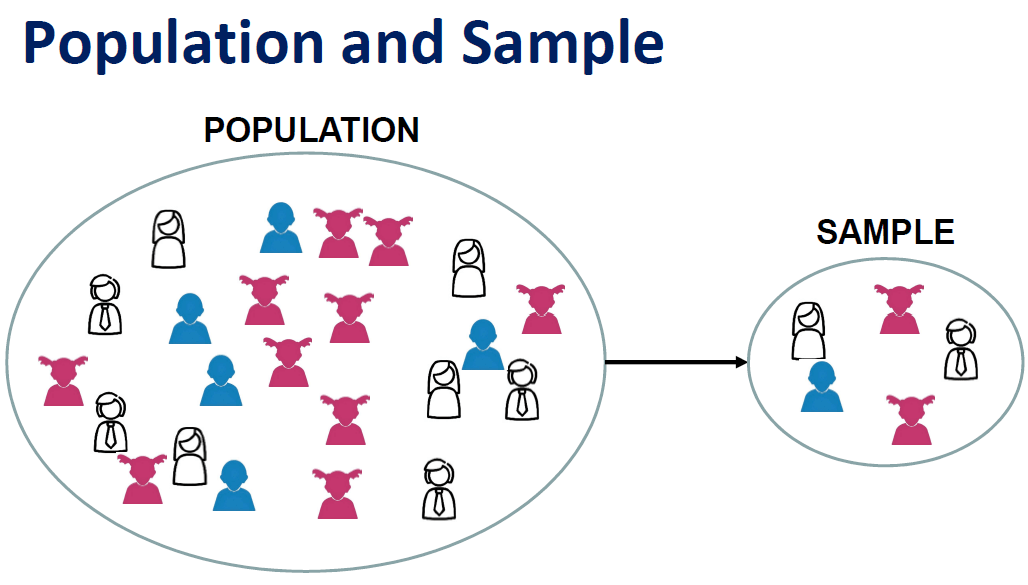
In Layman's terms, the population is the larger size and the sample is the smaller size derived from the population set.
Imagine you are at a birthday party and there are 20 kids there. The population is all the kids who could potentially come to the party, which is all the kids in your class, which might be around 30 or 40 kids. The sample is the smaller group of kids who truly came to the party with supposedly 10 kids.
Population
population = [10, 20, 30, 40, 50]

# Calculate the population mean
population_mean = sum(population) / len(population)

# Print the population mean
print("Population mean:", population_mean)
In this code, we define a population of numbers called population. We calculate the population mean by summing all the numbers in the population and dividing by the number of elements in the population. We store the population mean in the population_mean variable, and print it using the print() function.
Sample
import random

population = [10, 20, 30, 40, 50]
sample_size = 3

# Generate a random sample from the population
sample = random.sample(population, sample_size)

# Calculate the sample mean
sample_mean = sum(sample) / sample_size

# Print the sample and sample mean
print("Sample:", sample)
print("Sample mean:", sample_mean)
In this code, we first import the random module, which provides functions for working with random numbers. We define a population of numbers called population and a sample size of 3. We then use the random.sample() function to generate a random sample of size 3 from the population. We calculate the sample mean by summing all the numbers in the sample and dividing by the sample size. Finally, we print the sample and sample mean using the print() function.
Random Variables
A random variable is a way of describing an event or outcome that can happen randomly or by chance. For example, if you flip a coin the outcome is random - it could be heads or tails. we can present the result of the coin flip using a random variable where the variable can take on two possible values:
“heads” or “tails”.
A random variable can also represent more Complex events like the height of people in a group. The height of each person is a random variable and the possible values for the variable can be any real number within a certain range.
Random variables are used in statistics and probability to represent uncertain events and they allow us to make predictions and calculate probability based on the possible outcomes.
import numpy as np

# Define a random variable with a normal distribution
mean = 0
std_dev = 1
size = 1000
rv = np.random.normal(loc=mean, scale=std_dev, size=size)

# Calculate the mean and standard deviation of the random variable
rv_mean = np.mean(rv)
rv_std_dev = np.std(rv)

# Print the mean and standard deviation of the random variable
print("Random variable mean:", rv_mean)
print("Random variable standard deviation:", rv_std_dev)
In this code, we first import the numpy library, which provides functions for working with arrays and numerical data. We define a random variable called rv with a normal distribution with mean 0 and standard deviation 1, using the np.random.normal() function. We specify a size of 1000, which means we generate 1000 random values for the variable. We then calculate the mean and standard deviation of the random variable using the np.mean() and np.std() functions, respectively. Finally, we print the mean and standard deviation of the random variable using the print() function.
Note that many other types of random variables can be modeled using different probability distributions, and Python provides many libraries for working with probability distributions and random variables, such as scipy.stats and statsmodels.api.
We'll understand the distributions in Statistics further, so don't worry about that!
NOTE:
Random Variables are divided into 2 categories, those are;
Numerical random variable
Categorial Random variable
Numerical Random variable is further divided into more two kinds which are;
Discrete Random variable
Continuous Random Variable
That's the end of the article readers!
Will be explaining more in my following blogs!
"Without big data analytics, companies are blind and deaf, wandering out onto the web like deer on a freeway." - Geoffrey Moore
Do subscribe and keep supporting! 😊